使用 Matplotlib 渲染 Latex 公式
使用 Matplotlib 渲染 Latex 公式
需求:将 Latex 公式转为图片,svg 或 png 格式。
其实我们熟悉的 matplotlib 就支持这个功能,可以应付一些简单的情况(复杂的后面说)。
基本用法
import matplotlib.font_manager as mfm
from matplotlib.mathtext import math_to_image

prop = mfm.FontProperties(math_fontfamily='stix', size=64, weight='bold')
math_to_image(r"$\sum_{i=1}^n i$", "path/to/output.svg", prop=prop, dpi=72)
两行代码结束。下面解释一些内容。
math_fontfamily:数学字体。有多个选项(见 api),这个字体是我认为比较合适的、接近一般印刷体的。size:字体大小。weight:粗细。其实对数学字体不起作用。dpi:输出图像的 DPI。- 公式可以不全是 latex 公式,只有
$$内的才会解释为 latex。 - 输出可以是路径或 buffer。如果路径自带后缀名,可以不用指定 format。
图片边界问题
直接这样做会有一个问题。比如 ,它渲染出来是这样的:
$\frac{\partial\rho}{\partial t}=-\nabla\cdot\vec{j}$边界计算出了点问题,导致图片外围有部分被截断了。
如何解决这个问题呢?注意到,math_to_image 没有任何参数来控制 margin。但是我们可以重写一个!来看看它原来是怎样的:
def math_to_image(s, filename_or_obj, prop=None, dpi=None, format=None,
                  *, color=None):
    """
    Given a math expression, renders it in a closely-clipped bounding
    box to an image file.

    Parameters
    ----------
    s : str
        A math expression.  The math portion must be enclosed in dollar signs.
    filename_or_obj : str or path-like or file-like
        Where to write the image data.
    prop : `.FontProperties`, optional
        The size and style of the text.
    dpi : float, optional
        The output dpi.  If not set, the dpi is determined as for
        `.Figure.savefig`.
    format : str, optional
        The output format, e.g., 'svg', 'pdf', 'ps' or 'png'.  If not set, the
        format is determined as for `.Figure.savefig`.
    color : str, optional
        Foreground color, defaults to :rc:`text.color`.
    """
    from matplotlib import figure

    parser = MathTextParser('path')
    width, height, depth, _, _ = parser.parse(s, dpi=72, prop=prop)

    fig = figure.Figure(figsize=(width / 72.0, height / 72.0))
    fig.text(0, depth/height, s, fontproperties=prop, color=color)
    fig.savefig(filename_or_obj, dpi=dpi, format=format)

    return depth
它做的就是利用 parser 计算出公式的尺寸,然后画到 figure 上,再把 figure 保存。那么这里就有操作空间了,增加一下figsize。将这个函数复制一份,修改如下:
	fig = figure.Figure(figsize=((width+40) / 72.0, height / 72.0 + 1))
    fig.text(20 / width, depth/height, s, fontproperties=prop, color=color)
这样成功实现了增加 margin。
这里 margin 可以自适应调整一下。需要注意,fig.text 的坐标范围是归一化的 。
对输出图片做处理
下面实现了一个功能:将图片反色(默认是黑色字白色背景),并且去除背景色。
因为本来就是黑白的,所以只需要提取 rgb 之一的通道,将其取反后作为新的各通道值。
from io import BytesIO
from PIL import Image
import numpy as np

def get_img(tex: str):
    bfo = BytesIO()
    math_to_image(tex, bfo, prop=prop, dpi=72)
    im = Image.open(bfo)
    r, g, b, a = im.split()
    x = Image.fromarray(255 - np.array(r))
    im = Image.merge("RGBA", (x, x, x, x))
    return im
公式语法支持
Matplotlib 的 latex 语法是比较弱的,它只支持一个较小但常用的子集。暂时没看到完整版的支持列表。
目前已知不支持的有:
\LaTeX\color\mathrm\begin\varPhi\frac{}{}缺括号
与公式识别结合
这里我们尝试识别图片公式再渲染。一个免费的识别网站为 https://simpletex.cn/ai/latex_ocr
它的效果比 Mathpix 稍差,比如可能错误识别字体,\varphi 识别成 \phi,\hat 识别成 \widehat。
下面做一个简单的处理:
def sub_d(m: re.Match[str]):
    if (m.string[m.start() - 8:m.start()] == r"\mathrm{"
            or m.string[m.start() - 1] == "\\"):
        return m[0]
    return r"\!\mathrm{d}"

def fix_tex(s: str):
    s = re.sub(r"(\\frac)\s*(\\[a-zA-Z]+|\w)", r"\1{\2}", s) # 简单地加括号
    s = re.sub(r"\\color\{.+?\}", "", s) # 去掉 \color
    s = s.replace(r"\text", "") # 去掉 \text
    s = s.replace("e^", r"\mathrm{e}^") # 把 e 转为正体
    s = re.sub(r"(?<!([a-z]))d", sub_d, s)  # 微分符号
    s = s.replace(r"\widehat", r"\hat")
    return s
涉及到 \frac 括号匹配的稍微复杂点,需要做词法分析。如果工作量不大还是手动修复吧。
把公式绘制画布上
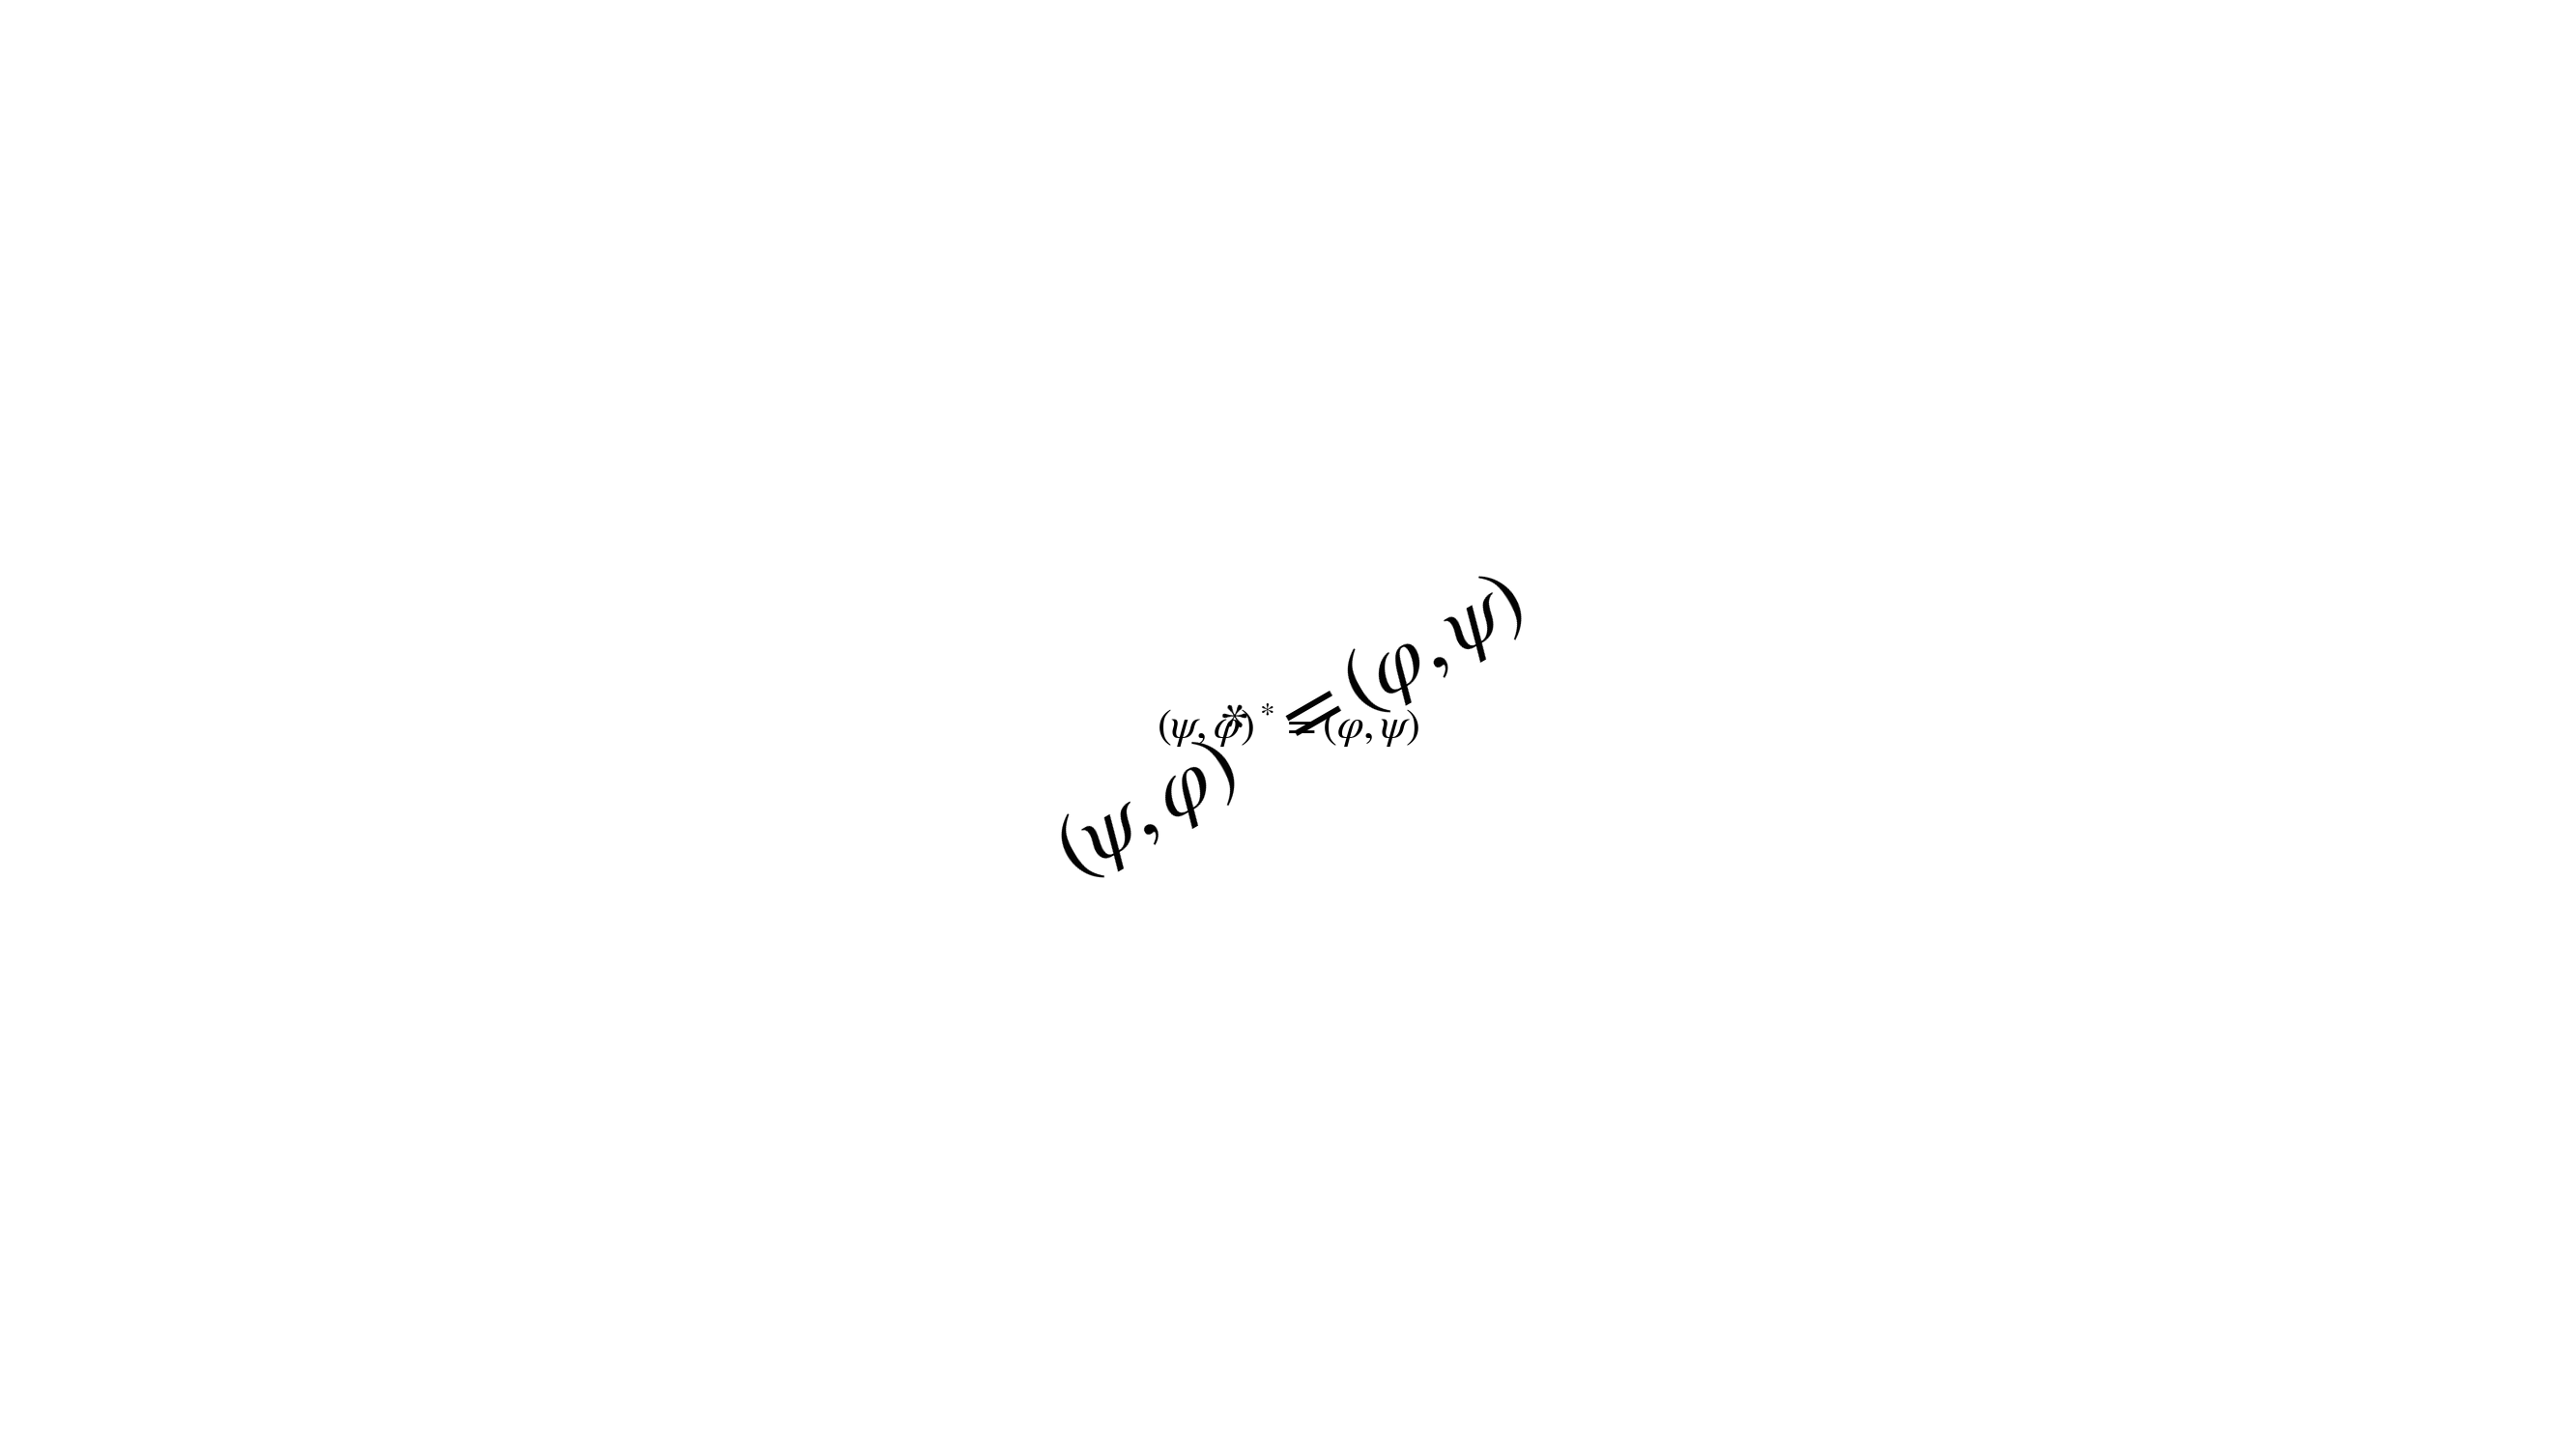
下面是一个示例。将公式 画到 Figure 上,两个均位于中心,一个旋转了 ,一个改变了字体大小。利用 Image 在 jupyter 显示。
def test():
    from matplotlib import figure
    from matplotlib.text import Text

    s = r"$(\psi,\varphi)^*=(\varphi,\psi)$"
    fig = figure.Figure(figsize=(1920 / 72.0, 1080 / 72.0))
    args = {
        "fontproperties": prop,
        "horizontalalignment": "center",
        "verticalalignment": "center",
        "animated": True
    }
    fig.text(0.5, 0.5, s, rotation=30, **args)
    fig.text(0.5, 0.5, s, fontsize=32 ,**args)
    bfo = BytesIO()
    fig.savefig(bfo)
    im = Image.open(bfo)
    return im

test()


